📣
Just Launched: Live 1-on-1 AI courses for Grades 3–10 — kids learn how AI works, never to lean on it


 Login
 Home


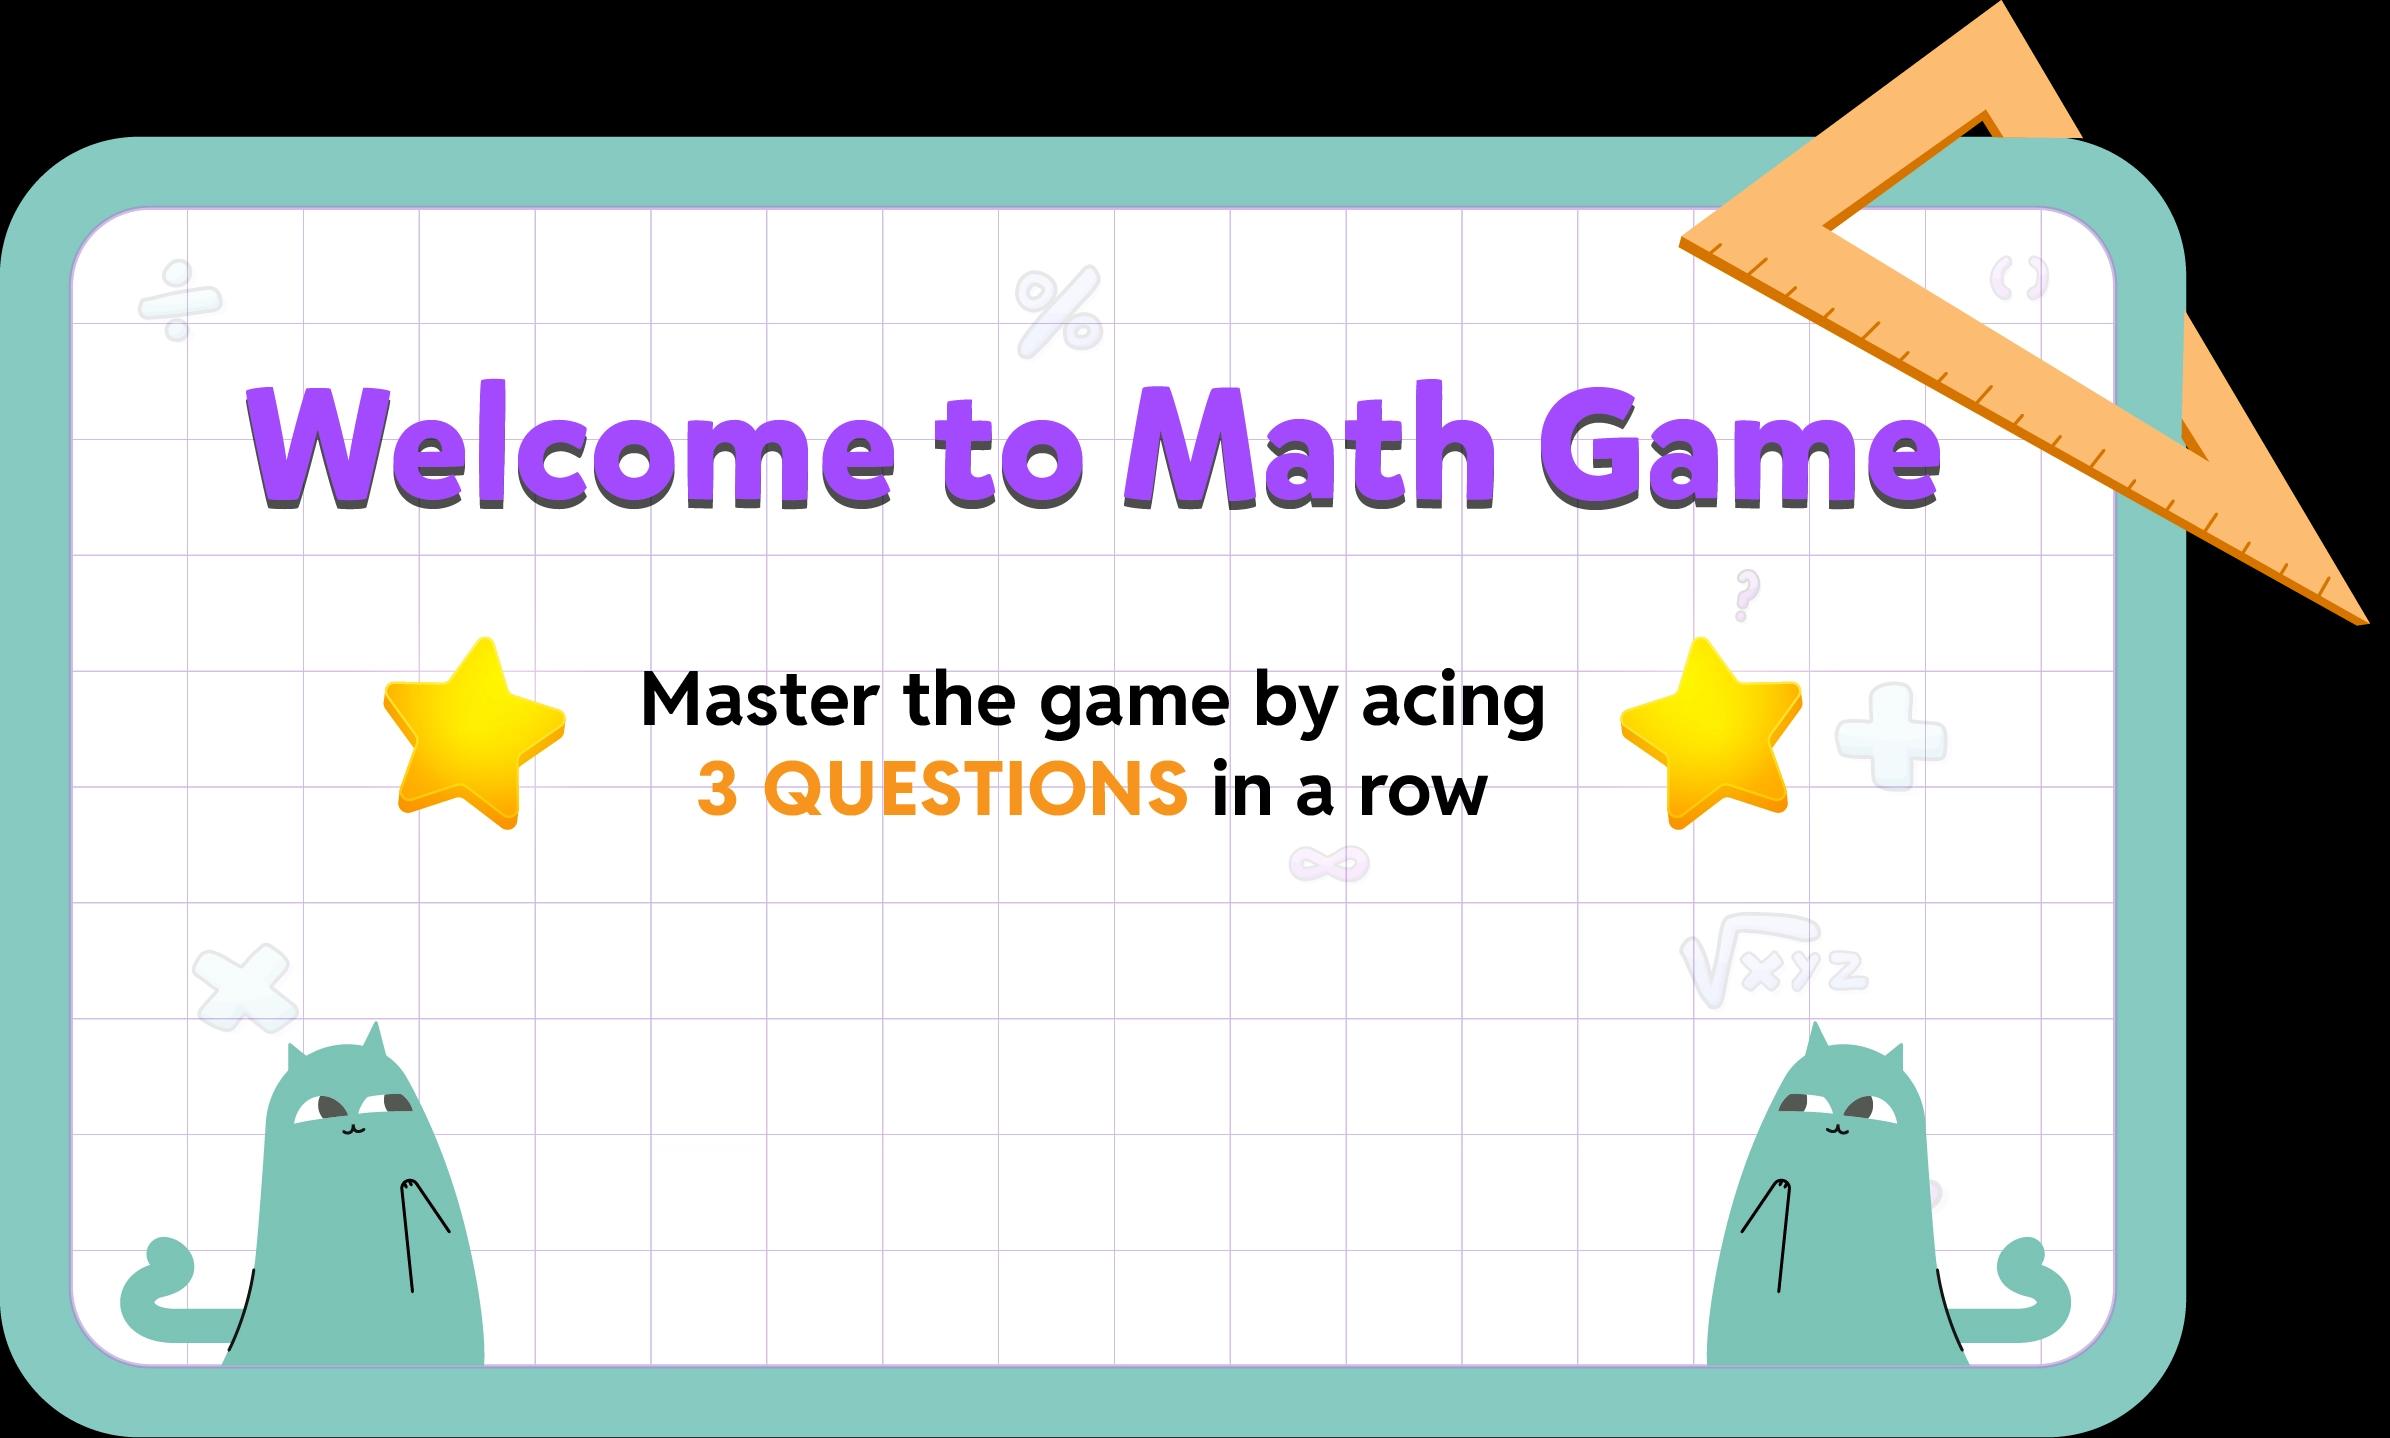
Boost your math skills with this fun and interactive game. Practice Mean, Median, Mode step by step and develop a deeper understanding along the way. Designed to build confidence and fluency, this activity makes learning enjoyable and effective. Tackle every question with curiosity and master Data Analysis and Statistics with ease!





What playful learning lies ahead?

Data Analysis and Statistics is a critical topic for Grade 9 students, forming the building blocks for advanced math skills. At beGalileo, we focus on step-by-step learning to ensure students grasp the concept thoroughly. Explore these engaging math games to develop a strong foundation in Data Analysis and Statistics and gain confidence in solving problems.
More on Data Analysis and Statistics
Mean, Median, Mode
Data Analysis and Statistics
Dive into questions regarding the Mean, Median, Mode by interpreting the provided statements. Strengthen comprehension through active problem-solving.
Mean, Median, Mode
Dive into questions regarding the Mean, Median, Mode by interpreting the provided statements. Strengthen comprehension through active problem-solving.
Bar Graphs, Histograms and Frequency Polygons
Engage with questions on the Bar Graphs, Histograms and Frequency Polygons by assessing the given statements. Build understanding through careful examination and practice.
Pie Charts
Engage with questions on the Pie Charts by assessing the given statements. Build understanding through careful examination and practice.
Stem and Leaf Plots
Engage with questions on the Stem and Leaf Plots by assessing the given statements. Build understanding through careful examination and practice.
Frequency Polygons
Explore questions related to the Frequency Polygons by analyzing the given statements. Enhance understanding through problem-solving and critical thinking.
Scatter Plots and Correlations
Dive into questions regarding the Scatter Plots and Correlations by interpreting the provided statements. Strengthen comprehension through active problem-solving.
Frequency Trees
Learn to use frequency trees to visually represent and calculate the probabilities of different events, especially compound events.

Empower Your Child's Future with FUN Personalized Learning!