📣
Just Launched: Live 1-on-1 AI courses for Grades 3–10 — kids learn how AI works, never to lean on it


 Login
 Home


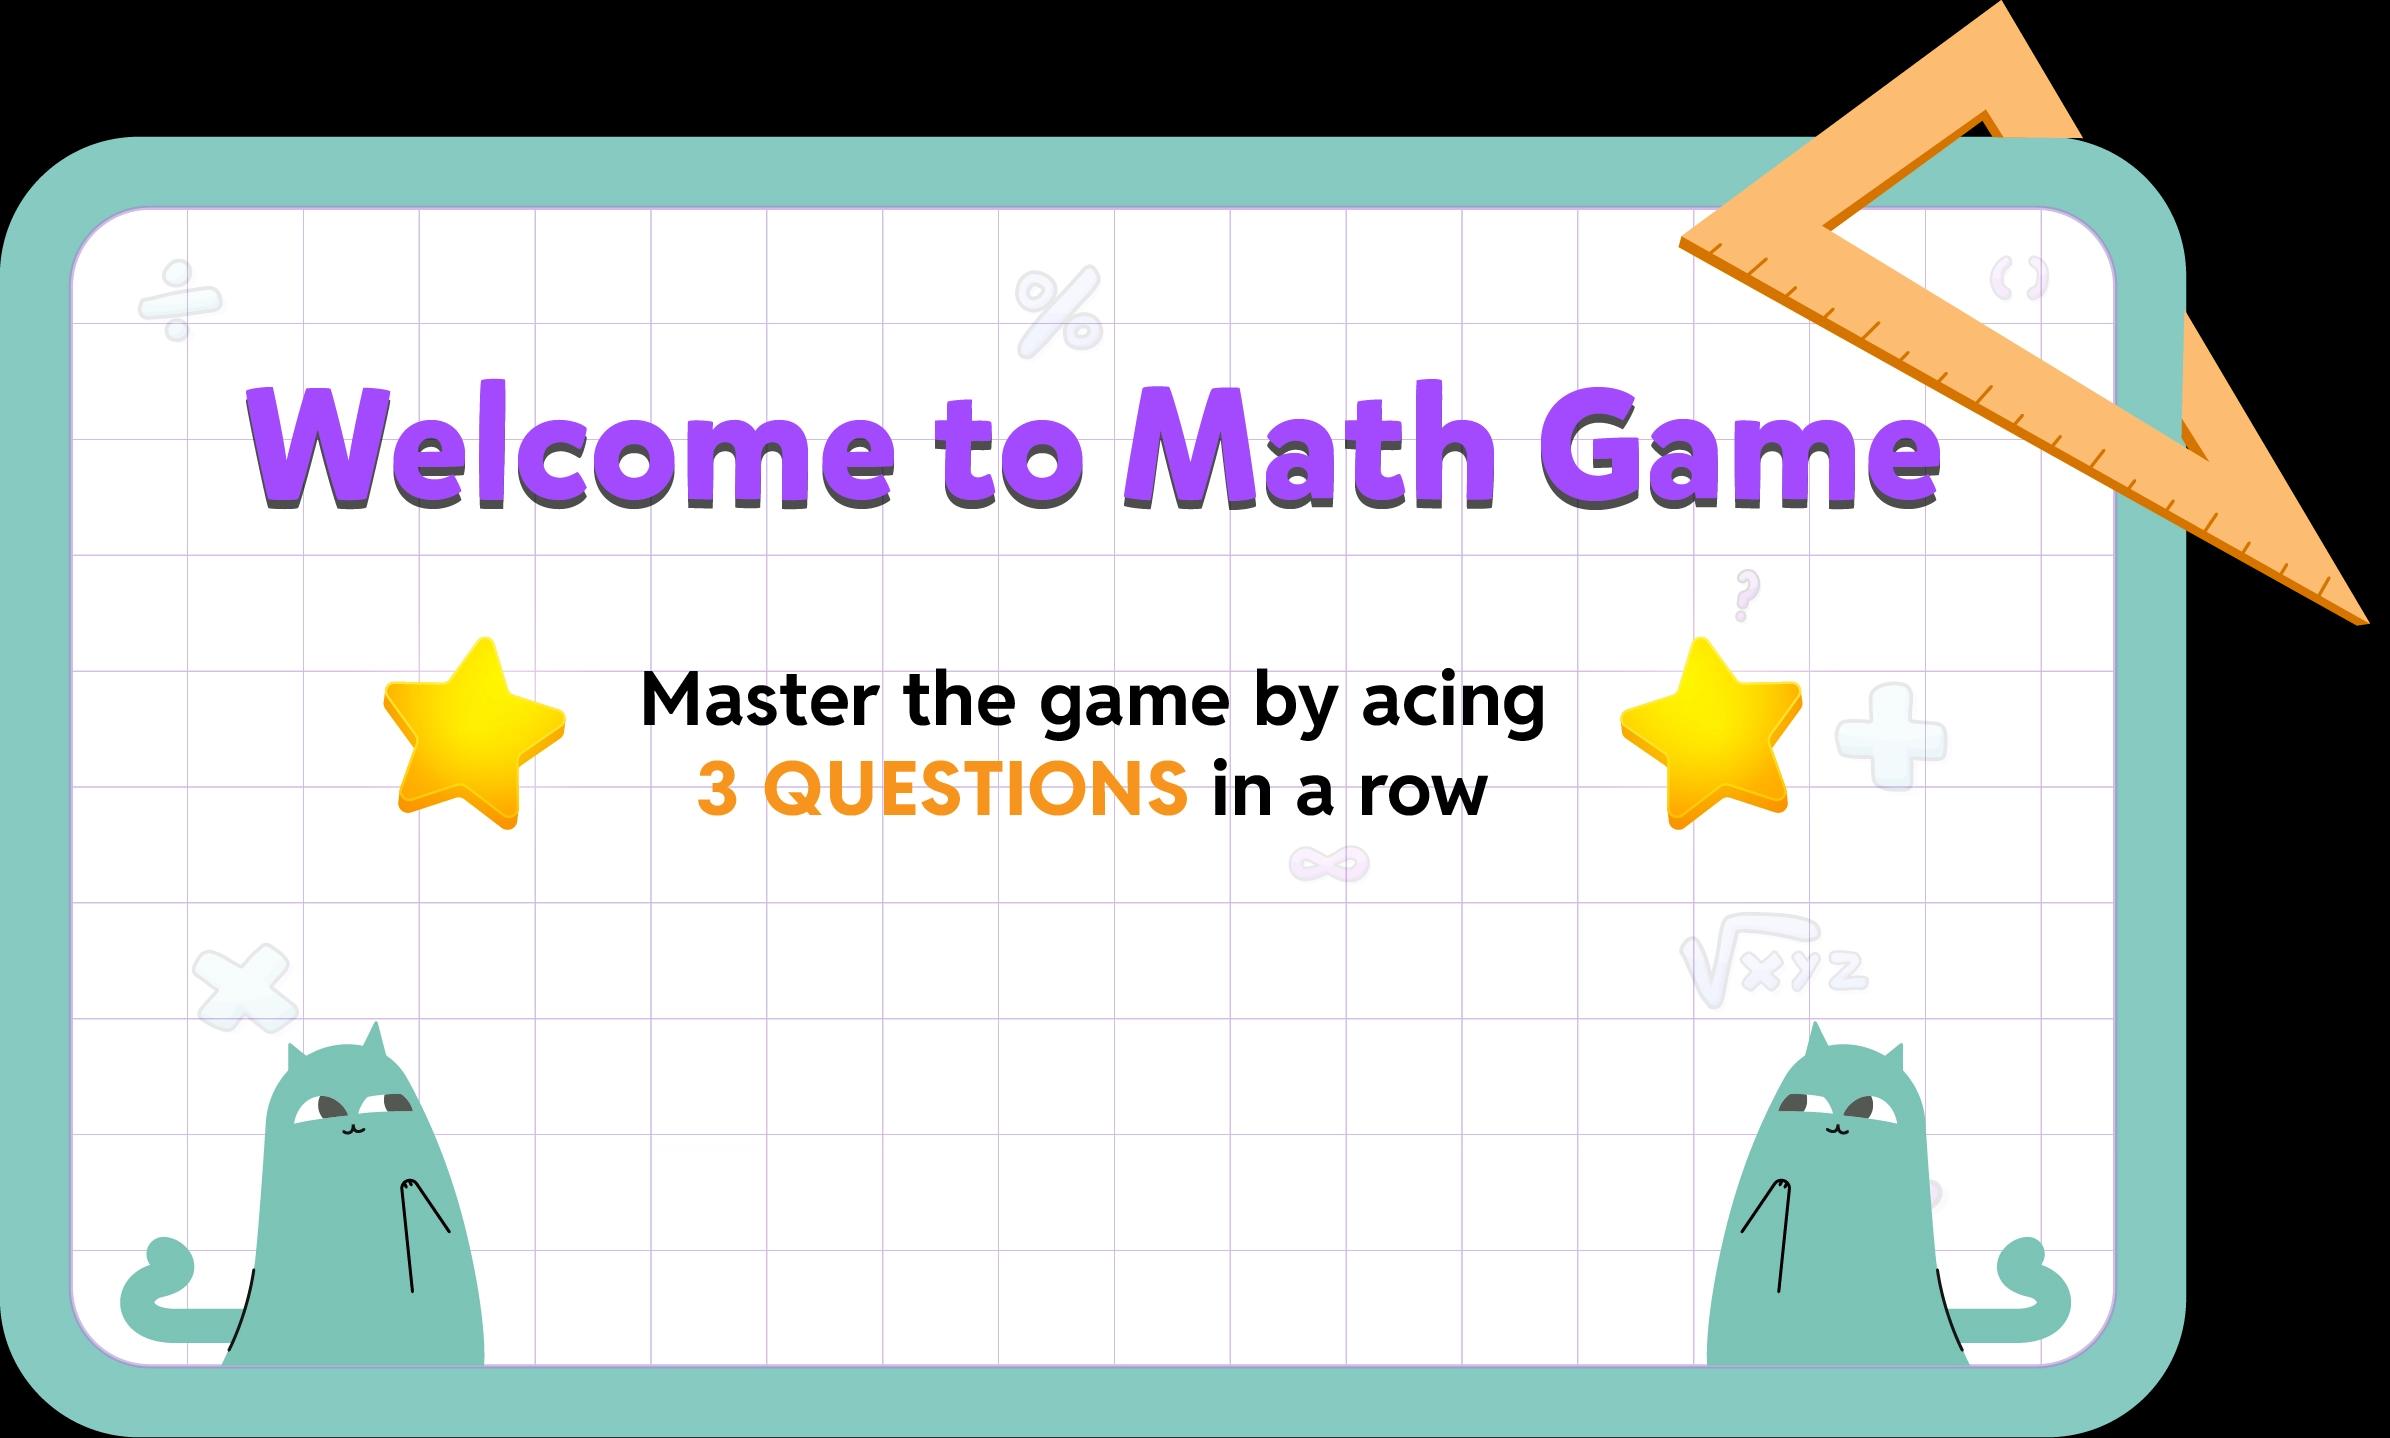
Students will explore exciting challenges in Data and Graphs as they work through Read data from Bar Graph. It helps children strengthen their skills in a fun and engaging way. Designed to make learning enjoyable, it encourages practice and mastery while building confidence in math.




What playful learning lies ahead?

As a key learning area for Grade 3, Data and Graphs plays a vital role in building math proficiency. With beGalileo, children learn this concept in a structured, step-by-step manner to ensure clarity and confidence. Dive into these additional games to reinforce understanding and master Data and Graphs with ease.
More on Data and Graphs
Read Data from Pictograph
Data and Graphs
Learn to read and interpret data from pictographs using visual symbols to represent information.
Read Data from Pictograph
Learn to read and interpret data from pictographs using visual symbols to represent information.
Read and Interpret Tally Charts
Learn to read data from tally charts, where data is organized using vertical lines or marks, often grouped in sets of five.
Read data from Bar Graph
Learn to read data from bar graphs, where the length of each bar represents quantities. Understand how to compare and interpret data from different categories.
Read and Interpret Line Plot
Understand to read line plots, which display data points along a number line. Learn to analyze trends and make observations from the plotted data.
Read Data from Pictograph
Learn to read and interpret data from pictographs using visual symbols to represent information.
Read and Interpret Tally Charts
Learn to read data from tally charts, where data is organized using vertical lines or marks, often grouped in sets of five.
Read data from Bar Graph
Learn to read data from bar graphs, where the length of each bar represents quantities. Understand how to compare and interpret data from different categories.
Read and Interpret Line Plot
Understand to read line plots, which display data points along a number line. Learn to analyze trends and make observations from the plotted data.


Empower Your Child's Future with FUN Personalized Learning!

